State of the Lake 2019
Aquatic Ecosystem Research
Download the PDF version here
EXECUTIVE SUMMARY
The following is a bulleted outline of findings from the 2019 water quality monitoring program at Lake Wononscopomuc.
- The water column was stratified and very stable for the entire season.
- Resistance to mixing at the thermocline was strong (RTRM > 80) after May 21st meaning that there was a sharp drop in temperature/density at that depth.
- Temperature change above the thermocline was seasonal; the warmest temperatures of 26 to 26.5°C were observed on July 9th and August 5th.
- Temperature change at individual strata below 13m of depth to the bottom was <1°C throughout the season.

- High levels of oxygen were observed throughout much of the water column.
- Concentrations of >8mg/L were measured in the top 10m of the water column on all sampling dates.
- The greatest concentrations were observed between the thermocline and the lower boundary of the metalimnion; oxygen was often measured between 12 and 14mg/L.

- At the deeper 30m sampling point (Site 1), oxygen concentrations of <1mg/L were first observed at 29 and 30m of depth on June 12th.
By October 2nd, concentrations of <1mg/L had extended up to a depth of 13m from the surface, which was over half of the total water column.
o At Site 2 (17m deep), concentrations of <1mg/L were also first observed on June 12th from the 14m stratum to the bottom.
Concentrations of <1mg/L were also observed at 13m of depth to the bottom on July 9th and at 12m of depth to the bottom on September 3rd and October 2nd.
- Nutrient concentrations remained low in the epilimnion but increased in the hypolimnion as anoxic conditions there persisted.
o Epilimnetic total phosphorus concentrations were between 6 and 15µg/L all season; the averages at Sites 1 and 2 were 10 and 11µg/L, respectively. However, phosphorus was non-detectable during several months.
- Hypolimnetic total phosphorus concentrations at Site 1 were 12µg/L on May 21st, 29 ug/L on June 12th, and 30ug/L July 9th. The concentrations then increased from 103 to 483µg/L between August 5th and October 2nd.
- At Site 2, hypolimnetic phosphorus increased from 46 and 59µg/L on May 21st and June 12th, respectively. Following, the phosphorus concentrations were 126 and 118µg/L on July 9th and August 5th, respectively, before peaking on September 3rd at 791µg/L. October 2nd concentrations were also high at 391µg/L.

o Epilimnetic total nitrogen was generally low throughout the season. Average concentrations were 260 and 240µg/L at Sites 1 and 2, respectively, with actual concentrations measured between 140 and 300µg/L. In some months, nitrogen concentrations were below detectable levels.
- Nitrogen was not detected in the epilimnion on June 12th at both sites; and, was not detected July 9th at Site 1.
- Total nitrogen concentrations in the hypolimnion were low or not detectable on May 21st and June 12th but then increased to 1,100 and 1,700µg/L at Sites 1 and 2, respectively by August 5th.
- At Site 1, a maximum concentration of 1,880µg/L was measured on September 3rd; the maximum at Site 2 occurred on October 5th and was 1350µg/L.
The largest constituent of total nitrogen in the hypolimnion was ammonia.

- Since 2015, nutrient levels have trended downward except for total phosphorus in the hypolimnion which has trended upward.
- Alkalinity and pH were high but consistent with historical levels.
- Epilimnetic alkalinity gradually decreased as the season progress.
- Hypolimnetic alkalinity increased as the season progressed.
Because of the high alkalinity or buffering capacity, pH was very stable with epilimnetic measurements varying from only 8.7 to 8.9, and hypolimnetic measurements falling between 7.5 and 7.7.
- Specific conductance was found to be trending upward.
o Average specific conductance at a depth of 1m of 284µS/cm in 2015 increased to 322µS/cm by 2019.
Increasing specific conductance is occurring in many lakes and has been associated with stormwater runoff containing deicing and other salts.
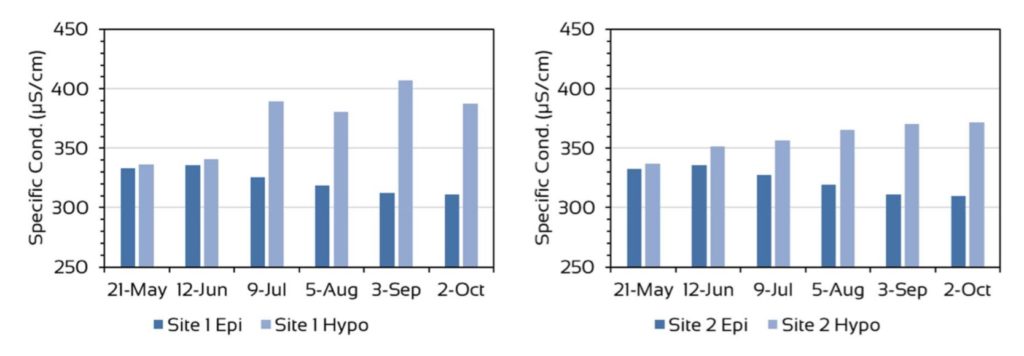
o The 2019 levels in the epilimnion decreased as the season progressed.
Levels increased in the hypolimnion after June 12th
- That increase was more distinct at Site 1 and more gradual at Site 2.
- Oxidation-reduction potentials (ORP) decreased to levels where phosphorus will load from bottom sediments to overlying waters at the bottom 2 to 3m of the water column on September 3rd and October 2nd at Site 1.
Lowest ORP at the bottom of Site 1 occurred on October 2nd.
o At Site 2, lowest ORP was observed on July 9th and continued to be low enough for phosphorus loading through September 3rd; but, those low ORP levels were confined to the bottom 2m of the water column on July 9th and bottom 1m of the water column afterwards.
- Algae concentrations, including Cyanobacteria (aka Blue-green algae), were determined from integrated samples of the top 3m of the water column and were low throughout the season.
- Highest concentrations from the integrated samples occurred at the beginning and end of the season; those elevated levels corresponded with the highest relative abundance of the Cyanobacteria.

- During the mid-months of the sampling season, other taxonomic groups
(e.g. diatoms, green algae, dinoflagellates) dominated or were co-dominant. o Highest concentrations of Cyanobacteria were not in the top 3m of the water column but were detected via fluorimetry below the lower boundary of the metalimnion throughout the season.
- Lake Wononscopomuc is best characterized as an early mesotrophic lake based on nutrient levels and oxygen depletion at the lowest depths.
o Algal productivity based on cell counts, was low and may be due – in part – to coprecipitation with calcium and magnesium carbonates.
- A number of physical and chemical properties of the lake provide an adaptive advantage to Cyanobacteria such as high pH, low nitrogen, and high specific conductance. o Phosphorus and nitrogen levels in the epilimnion are trending down since 2015; as is nitrogen in the hypolimnion.
- Phosphorus in the hypolimnion is trending upwards since 2015. o Specific conductance has been trending up since at least the 1970s.
- Data collection to determine the nature of the increase is not currently part of this program.

- A number of recommendations have been provided at the end of this report, including the incorporation of additional variables to include in the sampling protocol in the future, which will help to understand the nature of the increase of specific conductance at Lake Wononscopomuc.
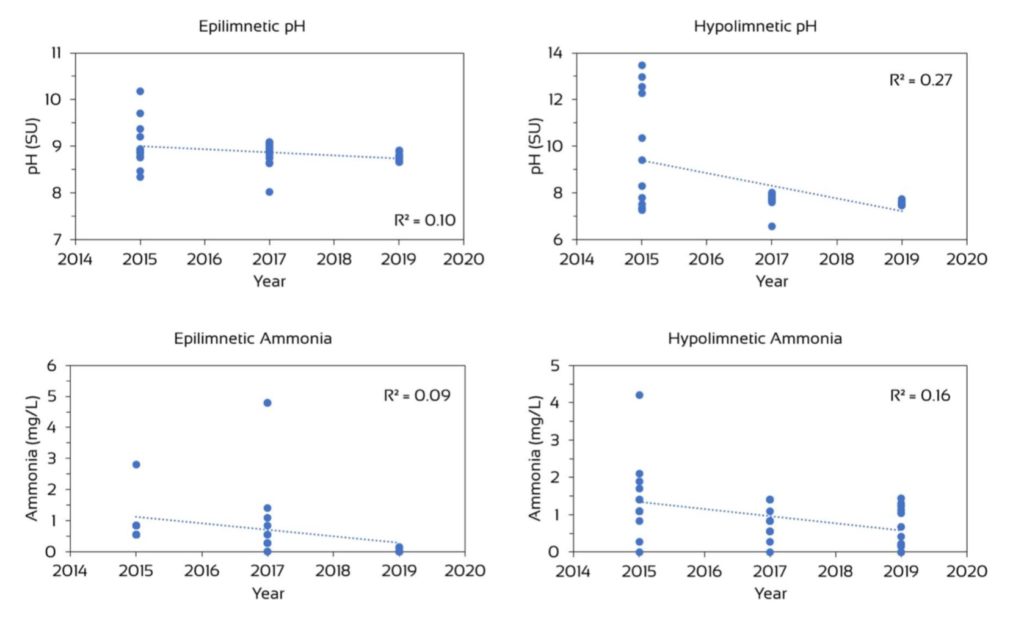

Figure 1. Regressions from ANOVA analyses of water quality variables that significantly changed between 2015 and 2019. Total Phos = total phosphorus, and TKN = Total Kjeldahl Nitrogen. Not pictured but significant was hypolimnetic alkalinity.
=========================